
What Is Turbidity and Why Water Operators Track It

A sudden rise in raw-water turbidity can be the first measurable sign of a catchment runoff event, a treatment-process upset, sediment disturbance or an ingress risk in a distribution network. What is turbidity? In operational terms, it is a measure of how suspended material in water scatters or blocks light. It is not simply an aesthetic issue. For utilities, industrial plants and environmental authorities, turbidity is a high-value indicator of water quality change that can affect treatment performance, disinfection confidence, compliance and public health risk.
What is turbidity in water?
Turbidity describes the cloudiness or haziness of water caused by particles suspended in the water column. These particles may include clay, silt, fine organic matter, algae, plankton, microbes, corrosion products, precipitated metals and process solids. The particles are often too small to settle quickly, particularly where water is moving through a river, reservoir, pipe network or treatment process.
A turbidity instrument does not usually identify the material creating the cloudiness. Instead, it quantifies the optical effect of those particles. Most instruments direct light through a sample and measure the light scattered at a defined angle, commonly 90 degrees. Higher scattering generally indicates higher turbidity.
The most widely used unit is the nephelometric turbidity unit, or NTU. A low NTU result typically indicates clearer water, while a higher result indicates a greater concentration of light-scattering particles. However, the relationship is not absolute. Particle size, particle shape, colour, refractive index and the optical design of the analyser all affect the reading. Two sources with the same mass of suspended solids can therefore produce different turbidity values.
Why turbidity matters to water operations
Turbidity matters because particles can carry or shield contaminants. In drinking-water treatment, particles may protect microorganisms from disinfectants, reducing the effectiveness of chlorination or ultraviolet treatment. A turbidity excursion after filtration may therefore indicate a potential barrier-performance issue, not just a visual change in the water.
High turbidity also increases treatment demand. Coagulation and flocculation settings may need adjustment, filters can load more quickly, backwash cycles may increase, and chemical consumption can rise. If operators only obtain a manual result once per shift or once per day, they may miss the rate and duration of a change that affects these decisions.
Within distribution networks, elevated turbidity can signal sediment mobilisation following a pressure event, main break, valve operation, source change or low-flow condition. It can also be associated with corrosion products and biofilm disturbance. The reading does not diagnose the fault by itself, but it provides an early operational prompt to investigate alongside pressure, flow, residual disinfectant and customer complaint data.
For wastewater and industrial applications, turbidity can support process control, discharge surveillance and trade-waste management. It may track solids breakthrough, poor settlement, abnormal influent loading or a change in process chemistry. In rivers, lakes and groundwater recharge environments, it helps agencies observe erosion, stormwater impacts, sediment plumes and construction-related disturbance.
Turbidity is not the same as colour or total suspended solids
These parameters are related, but they should not be treated as interchangeable.
Colour is caused by dissolved or suspended substances that absorb light. Tannins from vegetation, dissolved organic matter and some industrial compounds can make water appear coloured without generating a proportional turbidity result. Conversely, pale mineral particles can produce high turbidity with little visible colour.
Total suspended solids, or TSS), is a gravimetric laboratory measurement of the dry mass retained on a filter. It is often essential for wastewater reporting and process assessment. Turbidity is an optical measurement and responds differently to different particles. A site-specific correlation between turbidity and TSS can be useful, but it must be established using representative paired samples and reviewed when the source, season or process changes.
This distinction has practical consequences. An operator should not assume that an NTU value directly represents a fixed solids concentration, nor should they use turbidity as a substitute for microbial analysis, chemical analysis or compliance sampling where those measurements are required.
Where does turbidity come from?
The source depends on the water body and asset type. In surface water, rainfall can wash sediment, organic debris and contaminants from the catchment into rivers and reservoirs. Construction activity, bank erosion, agricultural runoff and algal growth can all produce short-duration peaks or sustained elevated readings.
In potable-water systems, raw-water quality may vary rapidly during high-flow events. Within a treatment plant, inadequate coagulation, floc carryover, filter breakthrough or backwash recovery can increase turbidity. In pipes and storage assets, settled deposits may be re-suspended when flow direction or velocity changes.
Wastewater turbidity is often associated with suspended organic solids, biological floc, industrial discharges and process instability. Here, the operational value lies in identifying deviations from an established baseline. A rising trend at a clarifier outlet, for example, can trigger inspection before a solids loss becomes a larger compliance or downstream-treatment problem.
How turbidity is measured reliably
Portable meters remain useful for field verification, commissioning and grab-sample investigations. Their limitation is temporal coverage. They show the condition at the time and place of sampling, rather than the full pattern of a changing system.
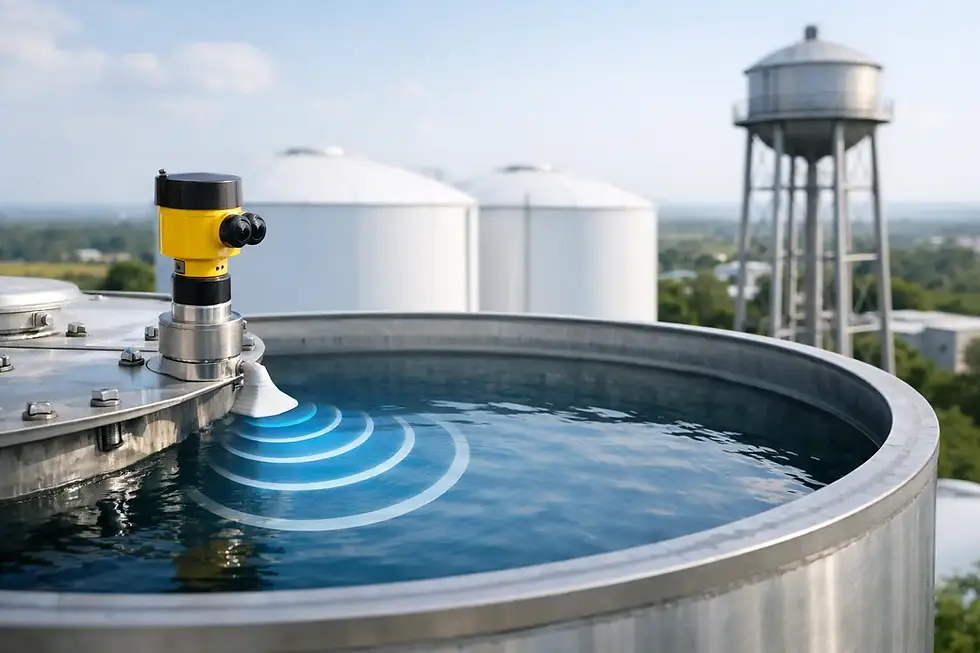
For critical assets, continuous online turbidity monitoring provides a more useful operational record. An autonomous analyser can measure at defined intervals, transmit results to a secure cloud platform and create alarms when limits, rates of change or persistence rules are exceeded. This enables teams to distinguish a brief spike from a developing event and to correlate turbidity with rainfall, flow, pressure, reservoir level or treatment-process data.
Reliable measurement requires more than fitting a sensor. The installation point must represent the water being assessed. Poorly mixed process streams, stagnant take-off lines and locations prone to air entrainment can produce misleading results. Bubbles scatter light and may appear as false turbidity. Similarly, direct sunlight, vibration, fouling and biological growth can affect some optical instruments if the design and installation do not manage those conditions.
A fit-for-purpose programme includes calibration verification, cleaning, maintenance records and periodic comparison with laboratory or portable reference measurements. The required frequency depends on source-water characteristics, process criticality, fouling risk and the instrument design. Field-proven systems that support remote diagnostics can reduce site visits, but they do not remove the need for disciplined quality assurance.
Setting limits that lead to action
A single turbidity threshold is rarely enough. Regulatory requirements may define limits for specific treatment stages or discharge points, but operational limits should also reflect the normal behaviour of the asset.
A raw-water intake may naturally show a substantial seasonal range, while filtered water should remain tightly controlled. For the intake, a rate-of-rise alarm can be more useful than a fixed alarm alone. For a filter outlet, a low absolute threshold and a persistence rule may be appropriate. A wastewater site may need separate alert logic for dry-weather conditions, wet-weather flows and known batch discharges.
The alarm must connect to a response procedure. That could involve checking analyser health, confirming the event with a secondary instrument, reviewing upstream process data, adjusting coagulant dose, isolating a filter, increasing sampling frequency or notifying a compliance team. Data without a defined response path creates noise rather than actionable insight.
Turning turbidity data into infrastructure intelligence
Continuous turbidity data becomes more valuable when viewed alongside other parameters. A turbidity rise with falling chlorine residual can indicate a different risk profile from a turbidity rise with stable residual. A rise occurring immediately after a pressure transient points operators towards distribution disturbance. A trend that follows rainfall and increasing source-water flow can support proactive treatment adjustments.
This is where cloud-based monitoring has a practical advantage. Time-stamped data from distributed assets can be displayed on a common operational view, assessed against alarm rules and retained for reporting and event investigation. Rather than relying on isolated manual samples, teams can see how water quality changed before, during and after an incident.
For complex networks, this visibility supports better prioritisation. Crews can be deployed to the sites showing the strongest evidence of change, maintenance can be targeted at recurring problem locations, and compliance teams have a defensible record of conditions and response actions. TracWater India applies this autonomous, cloud-connected approach to help operators turn field measurements into timely decisions across drinking water, wastewater and environmental applications.
The most useful question is not merely whether the water looks cloudy. It is whether the turbidity trend is normal for that asset, whether it is changing fast enough to affect treatment or compliance, and what operational action should follow. A well-designed monitoring programme gives those questions a measurable answer before a small disturbance becomes a larger water-quality event.



Comments